

Financial Literacy Infographic Ad
$359
Financial Literacy Infographic Ad
- Infographic DesignAccounting & Financial
- Guaranteed
- Watch (11)
Contest Closed
This contest is now closed. Start a new design contest like this today!
Note : Design brief last updated on
Contest title
What is your organization name?
Describe what your organization or product does and its target audience
Select your industry
Where do you expect to use this infographic?
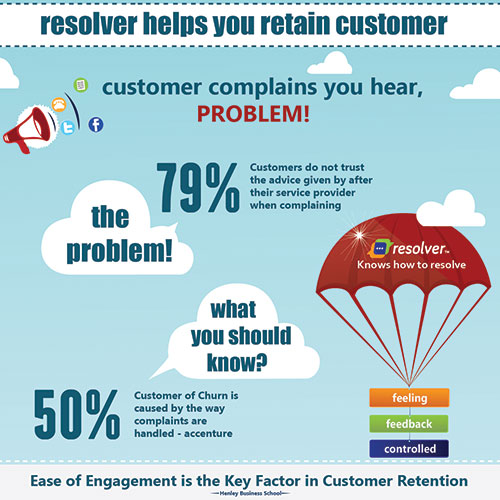
What story would you like your infographic to tell?
What data would you like to include in your infographic?
Describe any particular elements you would like to include in your infographic.
Visual Brief - Style


Visual Brief - Color

Other colors: Please use the color palettes that we've uploaded as attachments.
Visual Brief - Font
Other fonts: Simple readable font.
A design you’ll love or your money back. It’s that simple!
World's No.1 Graphic Design Platform
- Quick turnaround time
- 3M+ Satisfied Customers
- 150K++ Professional Designers
- Receive dozens of designs to choose from
- Receive print and web-friendly art files and full copyright
- Complete Copyright & Ownership
- 24x7 Free Customer Support
- 100% Money Back Guarantee! No questions asked!

Have some questions? or did not find what you were looking for? Don't worry! We can call and help you right away!
Call us at +1 415-853-3655
or


Need A Design?
Over 100,000+ business have used Designhill to source high quality graphic designs. There are two ways by which you can get a professional graphic design at Designhill:

Hire Multiple Designers
Best for when you want to crowdsource ideas. Multiple designers submit entries for you to rate and review before you award a winner.
- Fixed price packages
- Hand crafted designs from World-class designers
- Dozens of concepts to pick from
- 100% money back guarantee

Hire A Single Designer
Best for when you want to work with a single designer only. Explore the range of creative services offered by our highly talented designers.
- Work with a single designer
- Hand crafted designs from World-class designers
- Options within all price ranges
- Flexible turnaround time
Announcements & Public Discussion Board ×